本篇博客整理各种pandas中dataframe的操作技巧,长期更新。
1:原有列基础生成新列
常见使用情景:两列相减的值为新的一列,或者多列操作生成新的一列
技巧:
import pandas as pd

# make a simple dataframe
df = pd.DataFrame({'a':[1,2], 'b':[3,4]})
df
#    a  b
# 0  1  3
# 1  2  4

# this just creates an unattached column:
df.apply(lambda row: row.a + row.b, axis=1)
# 0    4
# 1    6

# do same but attach it to the dataframe
df['c'] = df.apply(lambda row: row.a + row.b, axis=1)
df
#    a  b  c
# 0  1  3  4
# 1  2  4  6
2:如何遍历Pandas Dataframe每一行
   c1   c2
0  10  100
1  11  110
2  12  120

In [18]: for index, row in df.iterrows():
   ....:     print row['c1'], row['c2']
   ....:
10 100
11 110
12 120
详见:https://stackoverflow.com/questions/16476924/how-to-iterate-over-rows-in-a-dataframe-in-pandas
3:Pandas Dataframe通过matplotlib画图如何鼠标滚轮缩放
主要缩放函数:
import matplotlib.pyplot as plt


def zoom_factory(ax,base_scale = 2.):
    def zoom_fun(event):
        # get the current x and y limits
        cur_xlim = ax.get_xlim()
        cur_ylim = ax.get_ylim()
        cur_xrange = (cur_xlim[1] - cur_xlim[0])*.5
        cur_yrange = (cur_ylim[1] - cur_ylim[0])*.5
        xdata = event.xdata # get event x location
        ydata = event.ydata # get event y location
        if event.button == 'up':
            # deal with zoom in
            scale_factor = 1/base_scale
        elif event.button == 'down':
            # deal with zoom out
            scale_factor = base_scale
        else:
            # deal with something that should never happen
            scale_factor = 1
            print event.button
        # set new limits
        ax.set_xlim([xdata - cur_xrange*scale_factor,
                     xdata + cur_xrange*scale_factor])
        ax.set_ylim([ydata - cur_yrange*scale_factor,
                     ydata + cur_yrange*scale_factor])
        plt.draw() # force re-draw

    fig = ax.get_figure() # get the figure of interest
    # attach the call back
    fig.canvas.mpl_connect('scroll_event',zoom_fun)

    #return the function
    return zoom_fun
如何使用(直接对matplotlib的轴对象ax进行操作即可):
 ax.plot(range(10))
 scale = 1.5
 f = zoom_factory(ax,base_scale = scale)
可选参数base_scale允许您将比例因子设置为您想要的值。
一定要确保缩放函数有个返回值对象f。所以如果你不保存f,该缩放返回值可能被垃圾回收。
演示:
详见:https://stackoverflow.com/questions/11551049/matplotlib-plot-zooming-with-scroll-wheel
4:pandas更改索引,更改index为某列
In [1]: import pandas as pd

In [2]: df = pd.read_csv('hello.csv')

In [3]: df
Out[3]:
    name  gender
0  Lucas    Male
1   Lucy  Female
2   Lily  Female
3    Jim    Male

In [4]: df.set_index('name')
Out[4]:
       gender
name
Lucas    Male
Lucy   Female
Lily   Female
Jim      Male
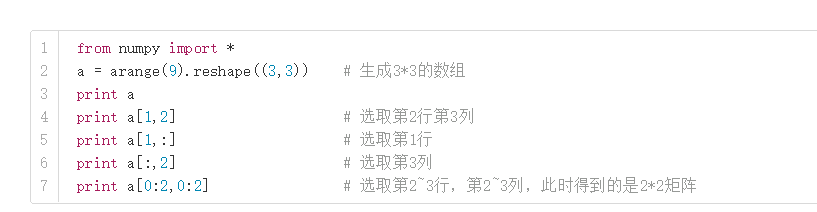
5:ndarray切片区域选取
In [1]: from numpy import *

In [2]: a = arange(36).reshape((6,6))

In [3]: a
Out[3]:
array([[ 0,  1,  2,  3,  4,  5],
       [ 6,  7,  8,  9, 10, 11],
       [12, 13, 14, 15, 16, 17],
       [18, 19, 20, 21, 22, 23],
       [24, 25, 26, 27, 28, 29],
       [30, 31, 32, 33, 34, 35]])

In [4]: a[1,2]
Out[4]: 8

In [5]: a[1,:]
Out[5]: array([ 6,  7,  8,  9, 10, 11])

In [6]: a[:,2]
Out[6]: array([ 2,  8, 14, 20, 26, 32])

In [7]: a[0:2, 0:2]
Out[7]:
array([[0, 1],
       [6, 7]])
语法:中括号中第一个选取就是行,第二个选取的就是列,中间用逗号隔开。
6:新增一列是某列的累加
In [1]: import pandas as pd
In [2]: num_list = [1, 2, 3, 4]
In [3]: df = pd.DataFrame(data=num_list)
In [4]: df[1] = df.cumsum()
In [5]: df
Out[6]:
   0   1
0  1   1
1  2   3
2  3   6
文章的脚注信息由WordPress的wp-posturl插件自动生成

 微信扫一扫,打赏作者吧~
![[整理]how to run flask with pyqt5](http://www.jyguagua.com/wp-content/themes/begin/timthumb.php?src=http://www.jyguagua.com/wp-content/uploads/2021/03/pyqt_flask.png&w=280&h=210&zc=1)
![[已解决]LINK : fatal error LNK1158: cannot run 'rc.exe' 错误的解决办法](http://www.jyguagua.com/wp-content/themes/begin/timthumb.php?src=http://www.jyguagua.com/wp-content/uploads/2021/02/Snipaste_2021-02-17_15-18-26-1024x505.png&w=280&h=210&zc=1)
![[已解决]Python扩展模块 error: Unable to find vcvarsall.bat](http://www.jyguagua.com/wp-content/themes/begin/timthumb.php?src=http://www.jyguagua.com/wp-content/uploads/2020/11/Snipaste_2020-11-19_10-01-38.png&w=280&h=210&zc=1)
![[整理]PyQt画圆,动态变色](http://www.jyguagua.com/wp-content/themes/begin/timthumb.php?src=http://www.jyguagua.com/wp-content/uploads/2020/08/drawCircle.gif&w=280&h=210&zc=1)